

Tracking the AI Compute Rollout With Taiwan Monthly Data
[Exclusive] The world's most-valuable how-to guide for watching, and predicting, the global AI compute rollout.

Good Evening From Taipei,
Last week I published a column explaining the depth of Taiwan’s AI supply chain. Judging by the reaction, that piece was a banger.
It was made possible by a lovely quirk in Taiwan’s securities law: All listed companies are required to publish their monthly sales by the 10th day of the following month. Even better, there’s a very systematic way the data is presented and uploaded. I don’t know of any other country which requires such regular and standardized disclosures.
As a result, Taiwan offers the best, most consistent, and deepest leading indicator of the state of global demand. Not just for AI compute but technology overall, plus a number of traditional industries including footwear, clothing, and even sports equipment. Following this data can offer insights many weeks and even months ahead of official quarterly earnings reports.

As a numbers nerd, this delights me. I’ve enjoyed bathing in this information for many years, and it’s always given me an edge in tracking the global electronics supply chain. There are other quaint Taiwan regulations which are also a boon for those of us seeking more data to analyze.
Today I’m going to explain how to use this data and what to look out for.
Before I start, there’s some rules of thumb worth following:
Be cautious of month-on-month growth numbers.
If in doubt, default to YoY growth data.
Always group January & February together, because Lunar New Year moves annually.
Some sectors are naturally lumpy, some are not. Learn which is which.
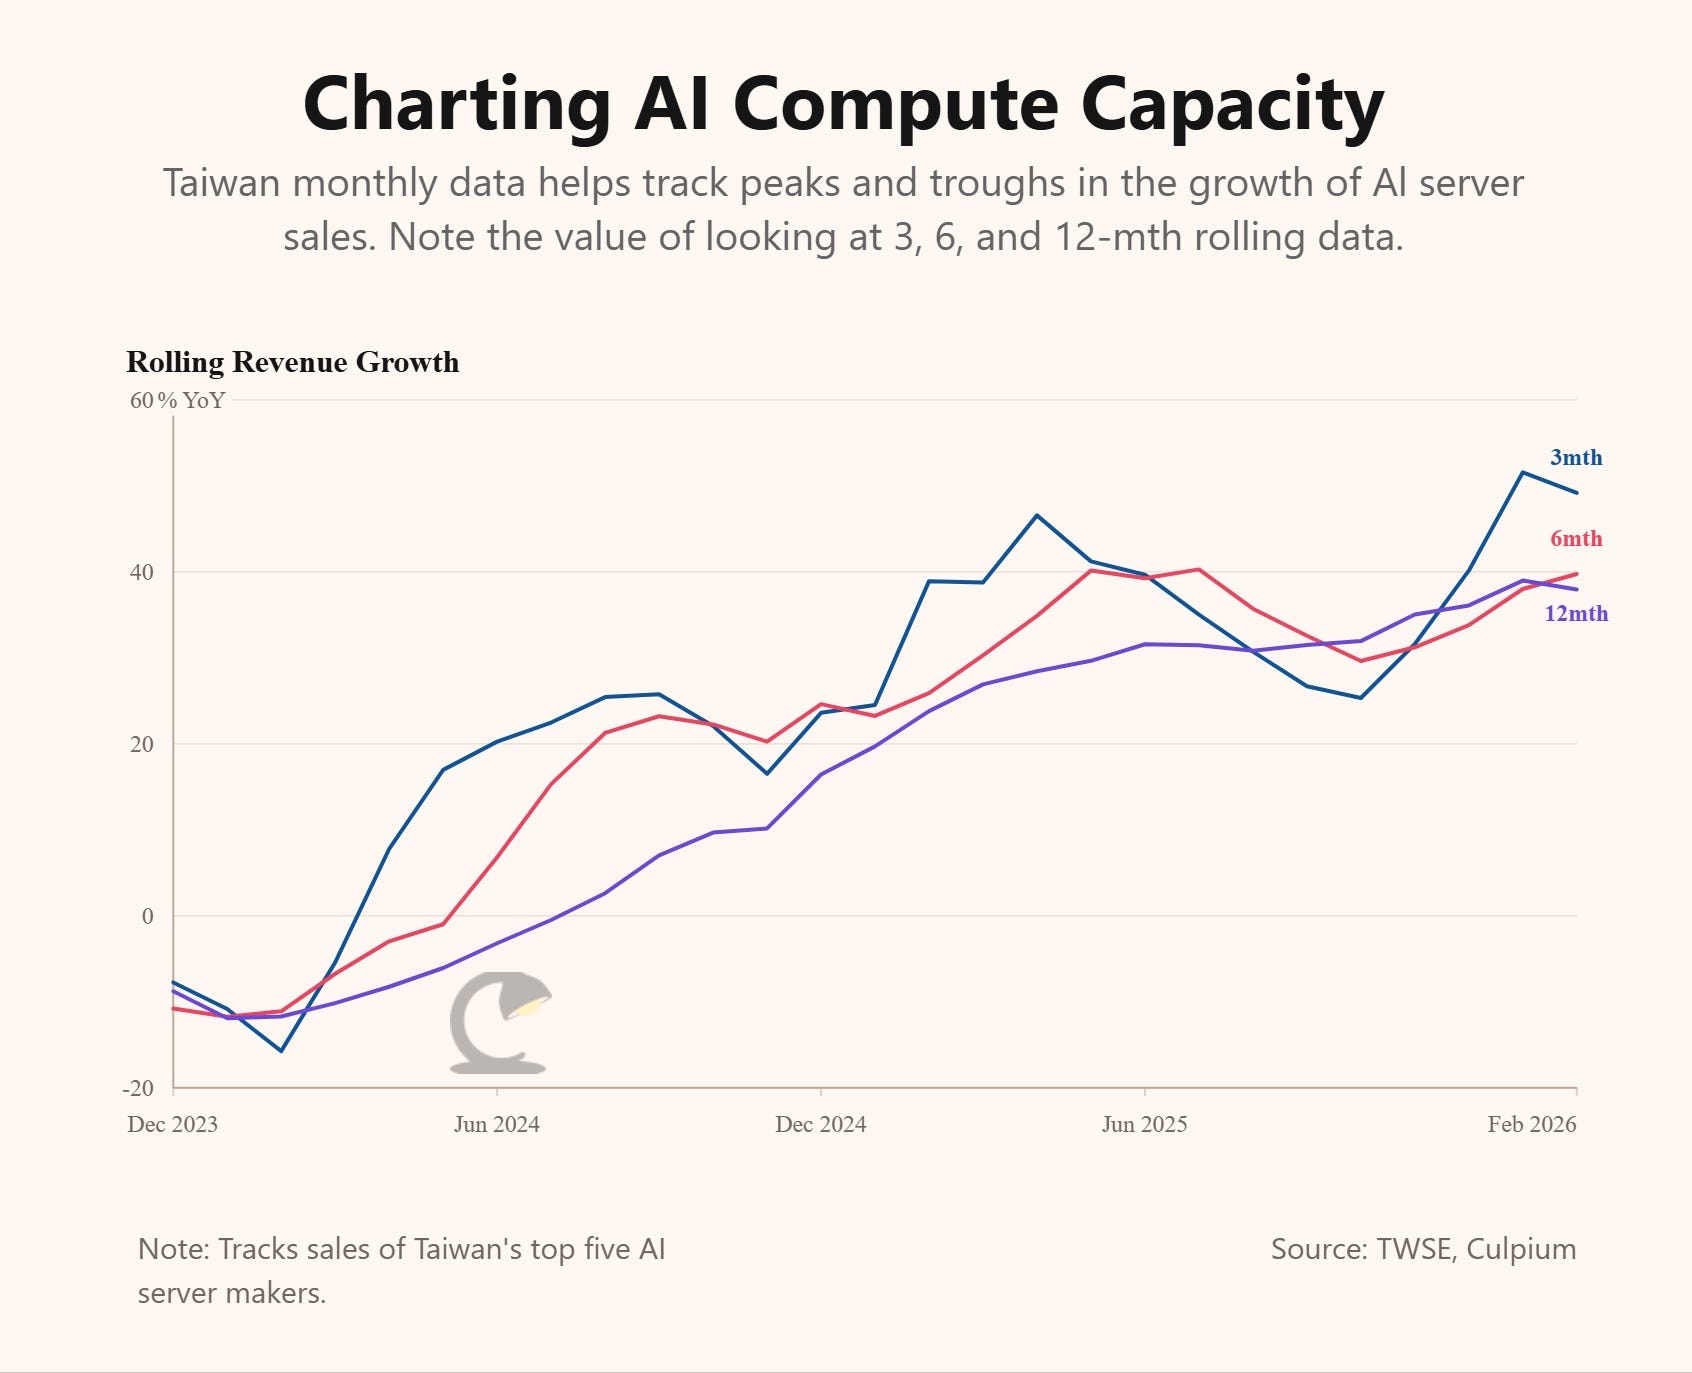
Rolling 12-month data can be quite helpful.
Sorting signal from seasonality is both an art and a science, which means it’s valuable.
Consider converting to USD for exporters in order to remove forex noise.
Meet MOPS
Taiwan’s filings are found through its Market Observation Post System, known locally as mops. It’s in traditional Chinese, but there’s an English language version with the same data. And since both the data and the upload process are standardized there’s zero lag between the time the English and the Chinese versions are posted.
I tend to use the Chinese version for two reasons. I know the tickers of all the companies I usually keep an eye on, but if I see weird data pop up for something that’s not on my radar I’m more likely to know the Chinese name than the English name. Secondly, I’m likely to yield more if I Google the Chinese name rather than the English. However, in the day of Google Translate you’re really not at much of a disadvantage if you can’t read Chinese. But bear in mind, Taiwan follows the ROC dating system. What’s called 2026 in the rest of the world is known as 115年 in Taiwan.
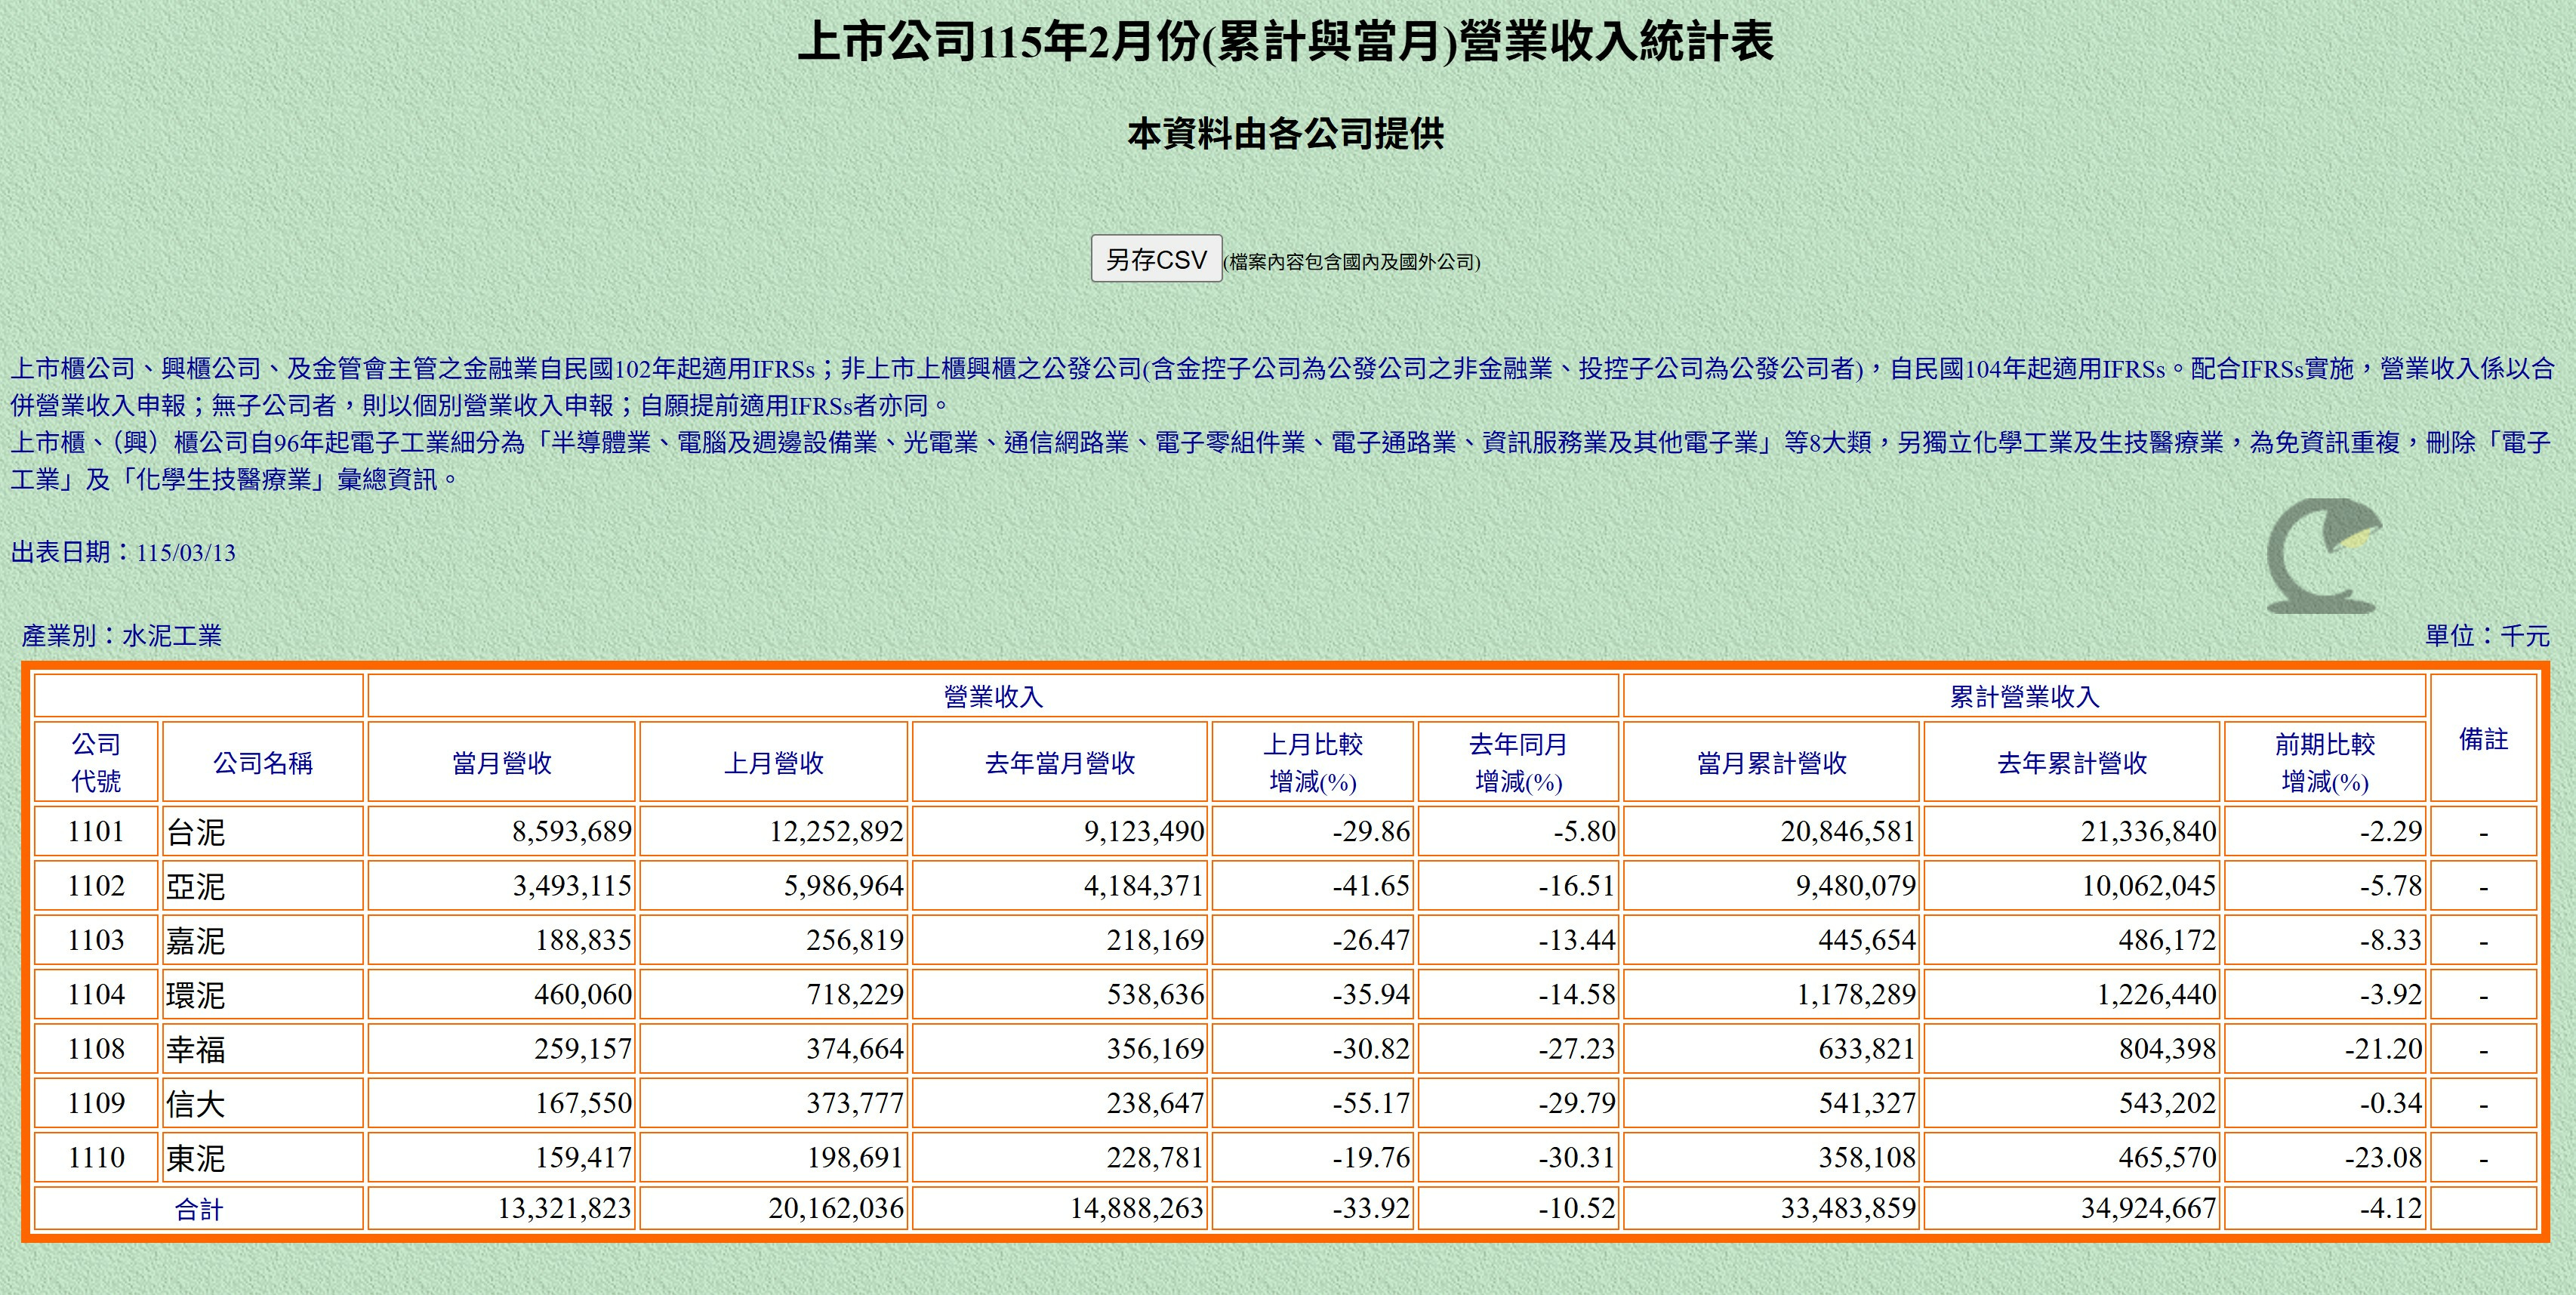
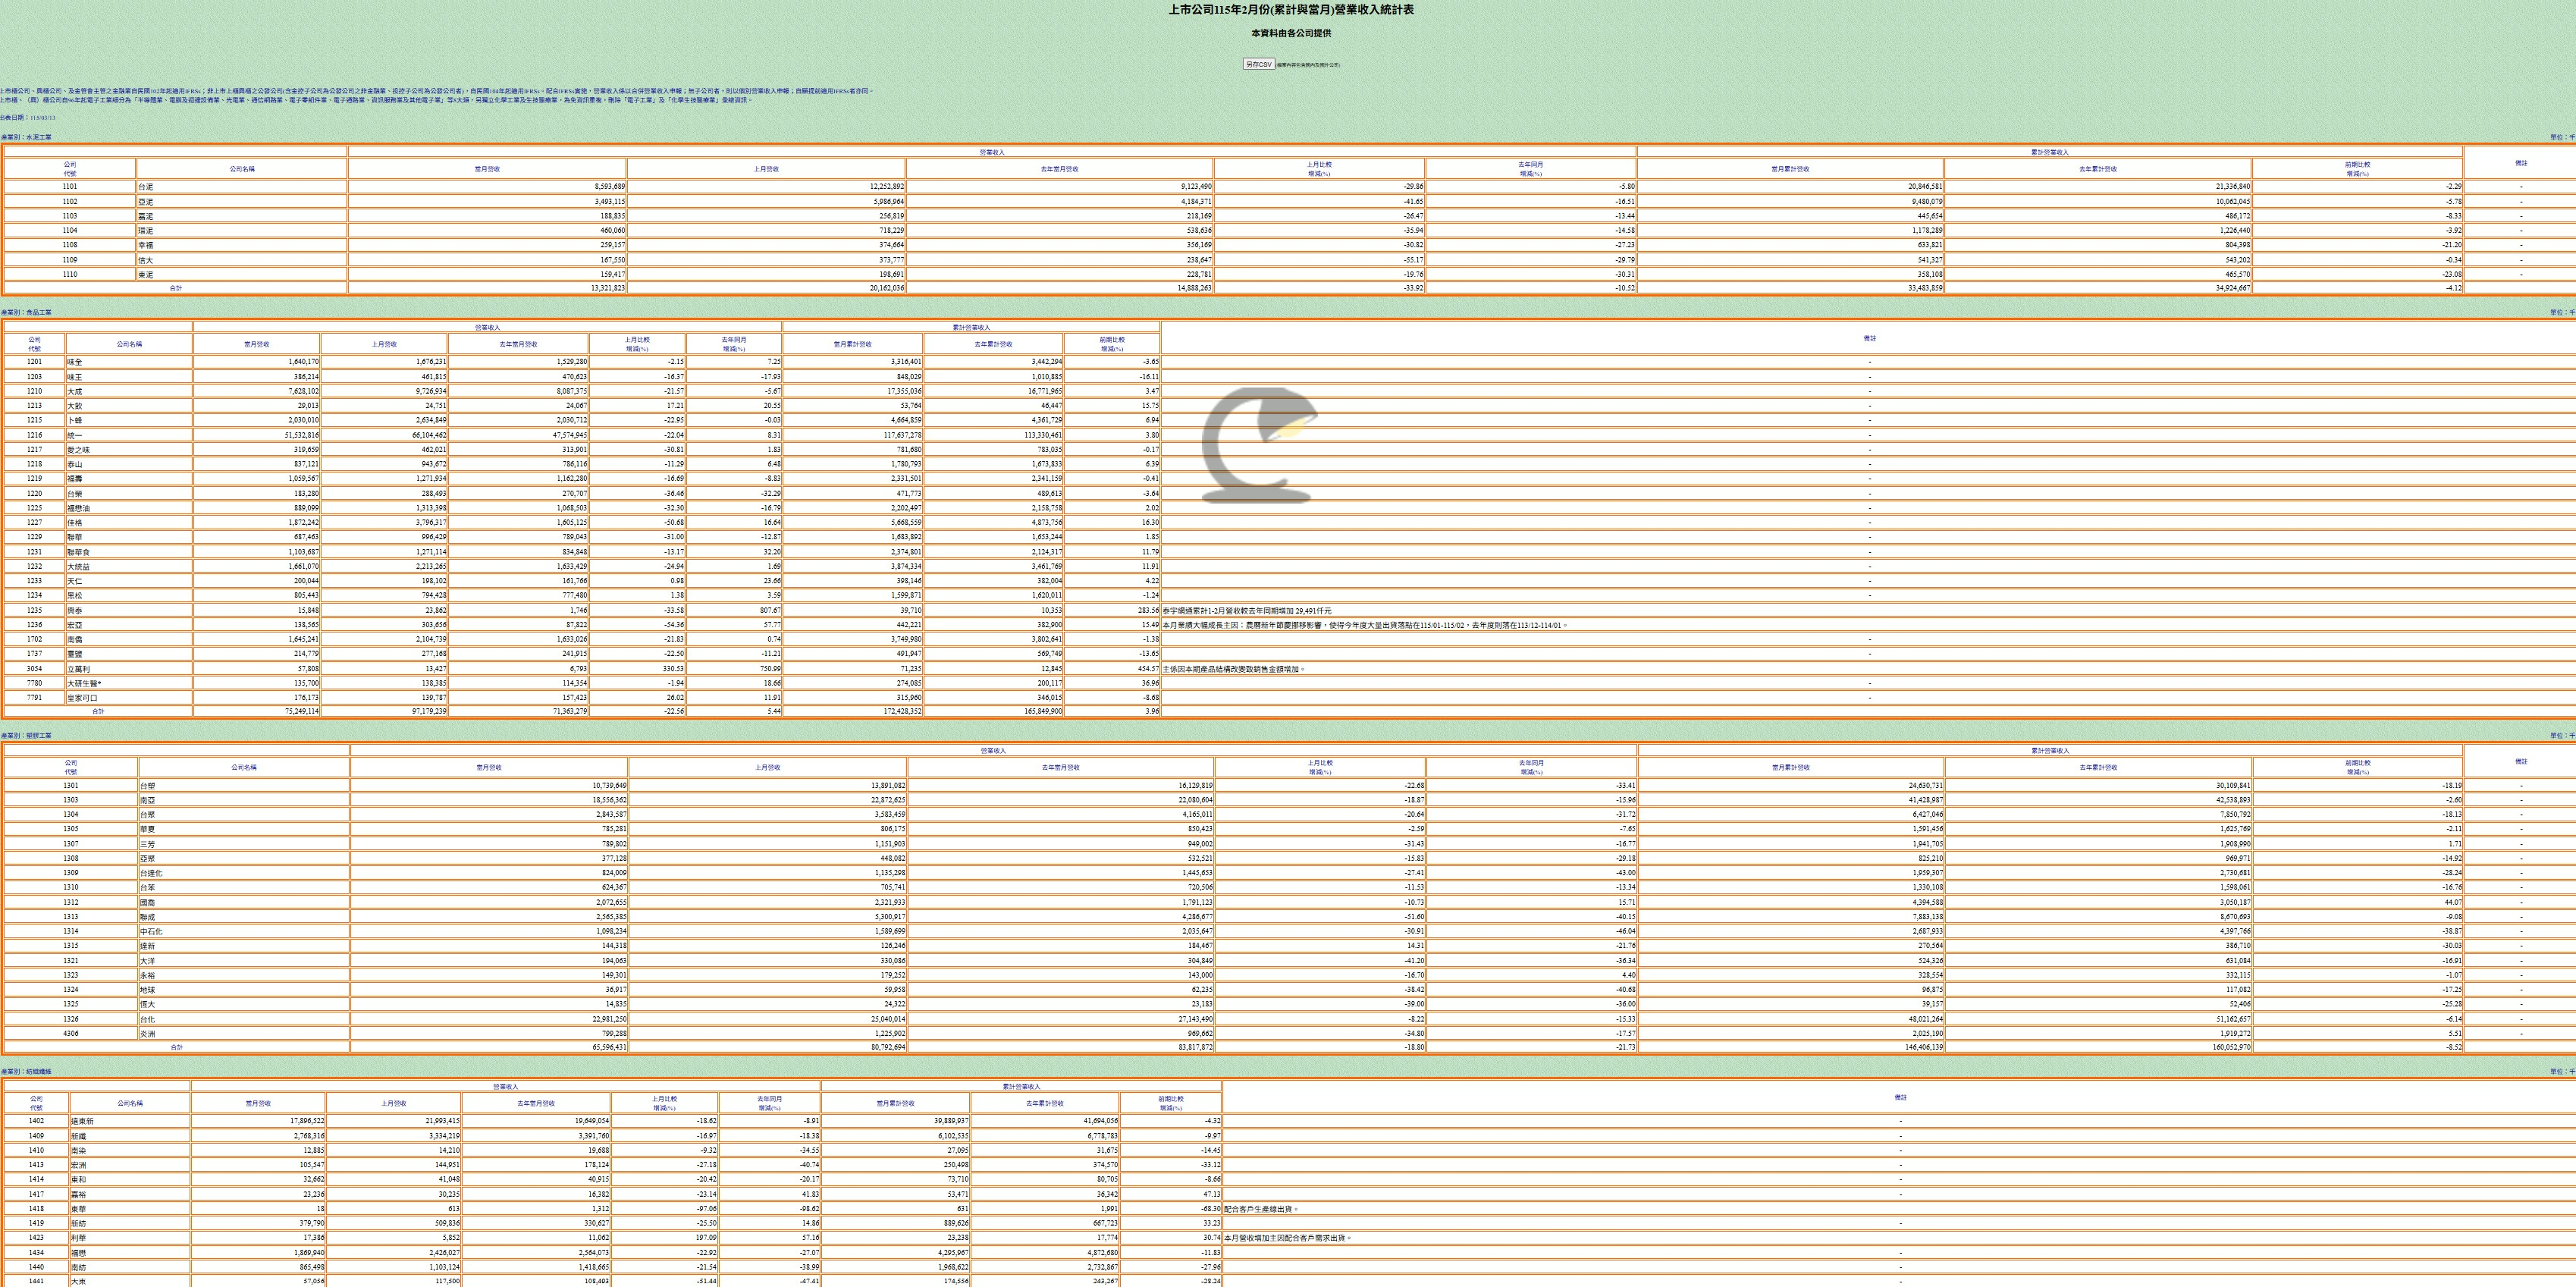
I won’t spend time telling you how to find and retrieve the data, ask your favorite LLM for help. But let me just point out that even if you read zero Chinese, you’ll see the letters “CSV” inside a button at the top center of the page. Click it and see what happens! Unfortunately, the English version doesn’t yet offer an easy CSV download (sad!).
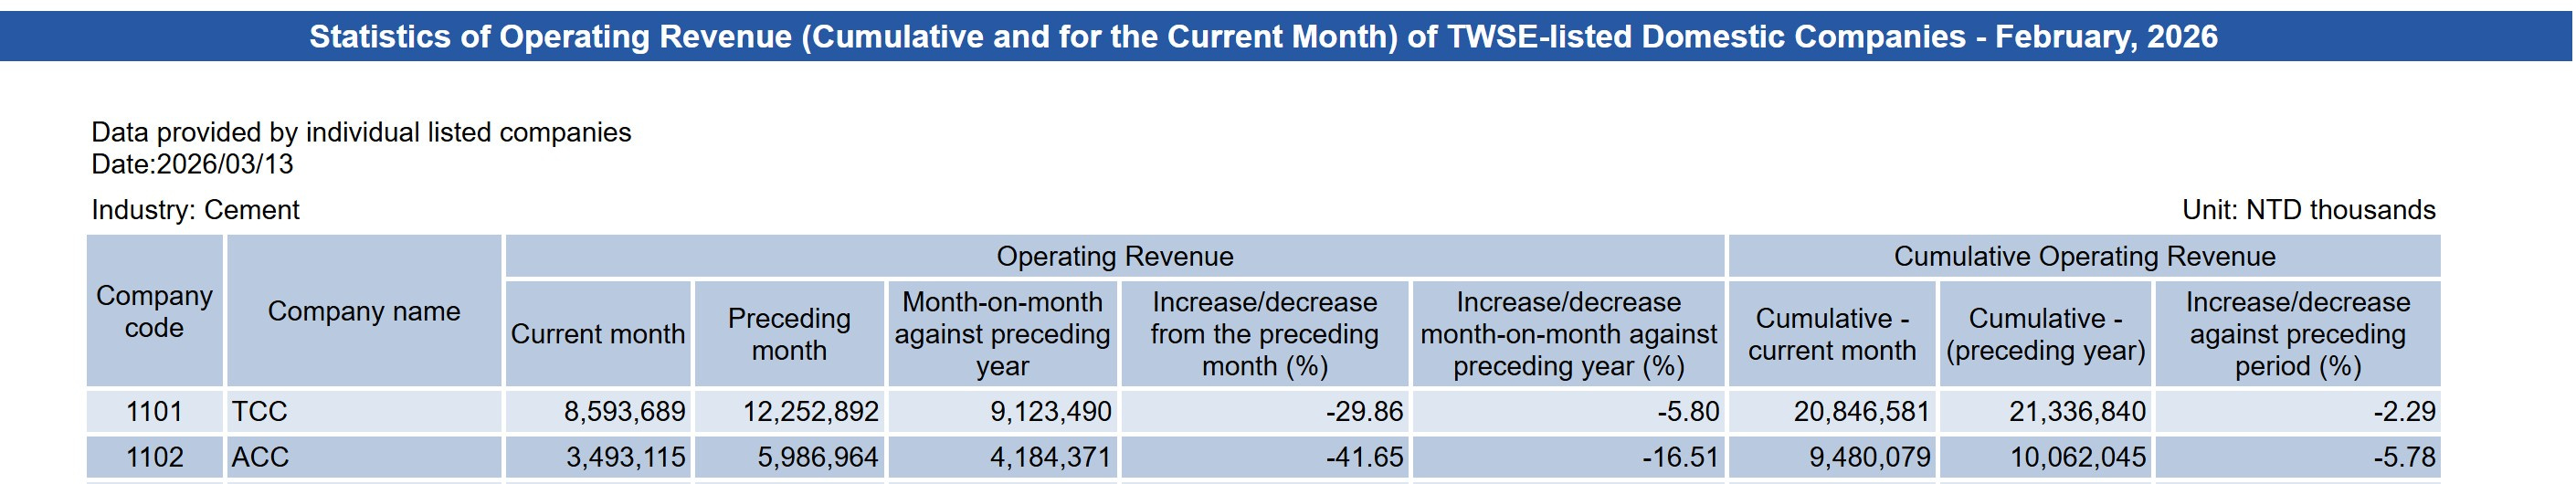
The first thing you’ll notice is that the data shows current month, prior month, same month year prior, and growth stats. This easy presentation of numbers alone is cool and super helpful. But there’s also cumulative year-to-date data. (Note my earlier caution about MoM data). So, March data will already show you first-quarter revenue well before official 1Q earnings are announced. For later quarters, you can just back out latest YTD from YTD of the prior quarter.
That’s why you’ll often see sell-side analysts and financial journalists writing about quarterly revenue well before the official announcement. That tends to kick off a round of analysts updating their earnings models. So, if you truly want to compare results versus estimates you should grab analyst forecasts before the 10th of the month — even better, before the quarter’s end.
Another helpful part of this data dump is that it’s clumped by industry group. From the first screenshot above, you can see that cement companies posted a 4.12% drop in revenue for the year through February. Industry category is based on whichever sector accounts for at least 50% of their operations. A company’s business can sometimes drift over time, and thus may appear on the cusp of a new category, but overall I think this delineation is about right.
Great Granularity
What I particularly love about Taiwan’s equities market categorization is how granular it is. Taiwan is a technology nation. Its economy and stock market reflect that fact, which means there’s delineation between different types of “tech.” There’s 33 categories overall, with eight subcategories of “electronics.” That means we can discern between semiconductors and optoelectronics, or electronic parts & components from electronic products distribution.
But it’s not perfect. Acer, which is a PC brand without factories, is categorized alongside its former manufacturing arm Wistron. As is Asustek and its spinoff Pegatron. Nevertheless, this segregation is good enough for a solid macro view of tech, and it’s pretty easy to build your own custom industry model in a spreadsheet anyway.
Supply chains in any sector are generally divided into upstream, mid-stream and downstream. That’s how I view tech, and I include equipment & capex in a fourth category. Here’s a non-exhaustive sample:
Upstream — TSMC, UMC, Winbond, Nanya Tech, ASE, Mediatek
Mid-Stream — Gigabyte, Cooler Master, Delta, Largan, Hon Hai, Mitac
Downstream — Hon Hai, Wistron, Quanta, Wiwynn, Inventec
Equipment & Capex — United Integrated Services, Favite
Upstream is where the seed of a product is planted: chips, passive components, chemicals, raw display panels. Mid-stream is where the saplings sprout, and includes modules, system trays, partially completed displays. While downstream is the stout tree, ready to be harvested. The boundaries between them is blurred, and companies often cross these lines. TSMC is most certainly only upstream but Hon Hai does end-to-end.
One peculiarity of Taiwan industry which distinguishes it from Japan and South Korea is that there are few vertically integrated conglomerates. There use to be more a few decades ago, such as a famous maker of rice cookers (iykyk), but today most integration is horizontal (meaning, at upstream, mid-stream or downstream). Foxconn is a rare example. For you and I, this means that tracking monthly sales offers great visibility into various stages of the supply chain. That’s harder to do for, say, Sony or Samsung unless you drill down into their quarterly data to work out which divisions contributed to revenue.
What To Look Out For
You know now what data is available, how to use it, and how to categorize companies by their place in the supply chain.
The final step is putting this all together, and one way to do so is to work backward from product launch.
Nvidia and AMD sell chips and servers, but they don’t make them. Hon Hai, Wistron, and Wiwynn do the servers (and TSMC produces the chips).1 But before these companies can assemble and ship a server to Nvidia, they need to buy the partially assembled parts such as compute trays, power suppliers, and cooling systems. That means the likes of Gigabyte and Cooler Master. But these companies must first get the chips and passive components from TSMC, Winbond, or even fabless companies like Mediatek and Realtek (via TSMC). (Note that Nvidia is a little unique in selling both chips and servers. Also, it doesn’t really sell raw AI chips, it actually ships most of them as modules assembled onto a printed-circuit board.)
Yet, these upstream players can’t do any of this until they’ve built their factories and installed equipment — that means UIS (as well as foreign suppliers like ASML and Applied Materials). They also need to set up ways to test what’s being produced, enter Favite.
As a rule of thumb, the lag to final product availability goes something like this:
36 months: Construction commencement to final product (not chip).
24 months: Equipment move in.
12-18 months: Start of chip production.
6-12 months: Packaged chip. Passive & other components.
3-6 months: Module assembly.
0-6 months: Final assembly.
You can and will find many exceptions to this timeline. New product introduction (NPI) can take a lot longer because everyone in the supply chain is on a learning curve. More complicated products and entirely new categories take longer, consumer electronics can be much shorter. Cars take forever if they’re European, no time at all if they’re Chinese.
Following trends across broader categories as well as subcategories is the bread and butter of supply chain analysis, but the true value is in finding and understanding outliers. The single most-important glitch in the matrix comes from inventory. A product made and shipped is not a product sold — a lot ends up in warehouses. CFOs hate inventory because it’s wasted money, but healthy inventory also means a business development team doesn’t miss out on a sale — CEOs hate opportunity cost. Unfortunately Taiwan monthly data doesn’t track inventory directly, but electronics distributors can be an imperfect proxy. As can export-import data.
That’s all you need to know to start your supply-chain-tracking journey. You can see that Taiwan monthly sales are robust, regular, and reliable. But the data still requires analysis.
Last week I put a poll at the end of my column — There’s a Whole Lot of Taiwanese AI Winners Not Called TSMC — where I ask whether you’d be interested in a regular Taiwan sales roundup. Please take the time to click over to that column and answer just one question. Culpium remains free, so your feedback is most valuable in guiding me toward delivering what you want and find interesting.
Remember, if you want to understand where AI is going then earnings numbers from Nvidia, AMD and Google will eventually get you there. But it’ll be a long way behind data on Taiwan monthly sales.
Thanks for reading.
More from Culpium:


Okay, AMD doesn’t sell servers. Yet. (Watch this space)
Thank you for sharing